Suggested Search
We know that reading an investment fund’s annual report or online updates can be confusing.
It’s important to understand what these reports mean, so you can monitor the performance of your investments and keep yourself on track to reach your investment goals.
Understanding fund performance and returns
A fund’s ‘performance’ describes how well it’s doing. Performance is measured in several ways, with one of the primary metrics being returns – how much additional money the fund has ‘returned’ to investors.
Returns are usually expressed as a percentage of the total investment. For example, if your $5,000 investment into a fund grew to $6,000 after the first year, your fund has delivered a 20% return.
There are different ways to measure returns and performance, with each offering unique insights for investors.
Investors rarely make money overnight. Typically, investors will need to leave their money in a fund for anywhere from three to 10 years to hit their targets. Over that time, a fund’s performance will vary and investors might find themselves making a loss one year (that is, a negative return) only to have their fortunes reverse in the next.
So, what if you’d like to know how much you’re making, on average, each year? How do you measure a fund’s rate of return, instead of the returns themselves?
Annualised performance is a useful way of measuring a fund’s performance over time. It effectively takes your total returns for a period of time and averages it out across the years.
A fund with an annualised performance of 7.5% over three years, for example, has delivered an average of 7.5% each year over that period, even if one of those years was negative.
Compound annual growth rates (CAGR) provide similar detail. ‘Compounding interest’ describes what happens when a fund reinvests its profits back into itself, so that your returns start earning their own investment returns.
CAGR measures returns on both your original investment (capital gains) as well as compounding interest. It averages the total out to give an idea of average annual fund growth.
Rolling returns report regular performance, usually monthly or quarterly, over a set period such as one, three or five years.
For example, a monthly, three-year rolling return chart would show the three-year annualised returns every month – that is, from January 2017 to December 2019 or February 2017 to January 2020. Using this example, it’s the three-year annualised return (or CAGR) plotted monthly.
Reporting rolling returns has the effect of smoothing out any volatility to provide a clearer picture of fund performance over a longer time horizon, which can be useful for investors with longer term investment objectives.
For example, compare the three-year rolling returns in Figure 4 with the same fund’s monthly returns in Figure 5.


Annual returns are a measurement of a fund’s total return for a specific one-year period, not including any of the associated fees and costs.
Funds typically charge management fees and may have other costs attached. Net returns show how much an investor has made after these fees and costs have been taken out.
Funds grow investors’ wealth in two ways:
- The assets they invested in become more valuable (capital gains)
- They receive income from the investments they hold (such as rents or interest repayments).
Growth returns is a measure of how much of a fund’s total returns come from capital gains. Distributions are a measure of how much income the fund’s investments have earned in a given time frame.
An index is simply a collection of stocks compiled to provide a snapshot of performance within a particular market (or market segment).
Some indices will group companies based on their size – for example, the ASX 200 which includes the 200 largest businesses listed on the Australian Securities Exchange.
Other indices might focus on specific industries, geographies, or even specific investment themes like ESG. Indices provide investors with a snapshot of a particular market’s performance.
A benchmark index is one used as a baseline by a fund to measure its own performance against. A fund can use any index as a baseline, so long as it tracks similar stocks to those the fund is investing in itself.
Outperformance and underperformance describe how well a fund did when compared with its benchmark index.
If your fund returns more than its benchmark, it has outperformed. Delivering a lower return than the benchmark represents underperformance.
This is helpful if you want to see how well your fund is doing relative to the broader market.
Overweight and underweight are used to describe the mix of assets owned by a fund, relative to its benchmark index. Investors use the word ‘weight’ to describe the percentage of a portfolio that’s invested into one type of asset or company.
Overweight, then, is how investors describe funds that hold more of a particular investment than their benchmark index does, in percentage terms.
Let’s say you invest in a technology fund, and it puts 17% or your money into Company A. If Company A’s weighting in the benchmark index is only 10%, then your fund is overweight Company A. If you switch those two numbers around, your fund would be underweight.
Funds are usually overweight on stocks they expect will do well and underweight on those they think will underperform.
These two terms describe how individual stocks have affected a fund’s overall return, albeit in slightly different ways.
Contribution refers to a stock’s overall effect on returns and is basically just a measure of its share price movement.
Attribution, on the other hand, looks at the effect of a stock’s positioning (ie, whether the fund was overweight or underweight) on overall returns. If your fund is overweight on a stock that outperforms, or underweight on a stock that underperforms, the effect on returns (attribution) will be positive.
Attribution can be used to gauge fund manager performance because it indicates their ability to pick stocks.
Fund types and investment options
Not all funds are managed the same way and will be described differently depending on how they invest, what they invest in, and who makes the investment decisions.
Single-sector funds only invest in one asset class, such as shares or fixed income investments, or into one market sector, like technology, resources, or health care.
As you might have guessed, multi-sector funds combine different assets, sectors, or both within the portfolio.
A single-manager fund is led by one professional investor and their team, and typically purchases assets directly.
A multi-manager fund is sometimes known as a ‘fund of funds’, and mixes investment strategies from several different managers. This can give investors access to a diverse range of assets, expertise and investing strategies.
A fund can usually be classified as either active or passive depending on how its portfolio is managed.
In an actively managed fund, the manager makes strategic decisions about how to structure the fund – which shares to hold, whether or not to take overweight positions, and when to make changes.
These managers are normally trying to outperform their benchmarks using their stock-picking skills.
A passive fund (also called an index fund) copies its benchmark index – its goal is to hold the same stocks with the same weighting as the index it tracks, with the overall aim of matching that index’s returns.
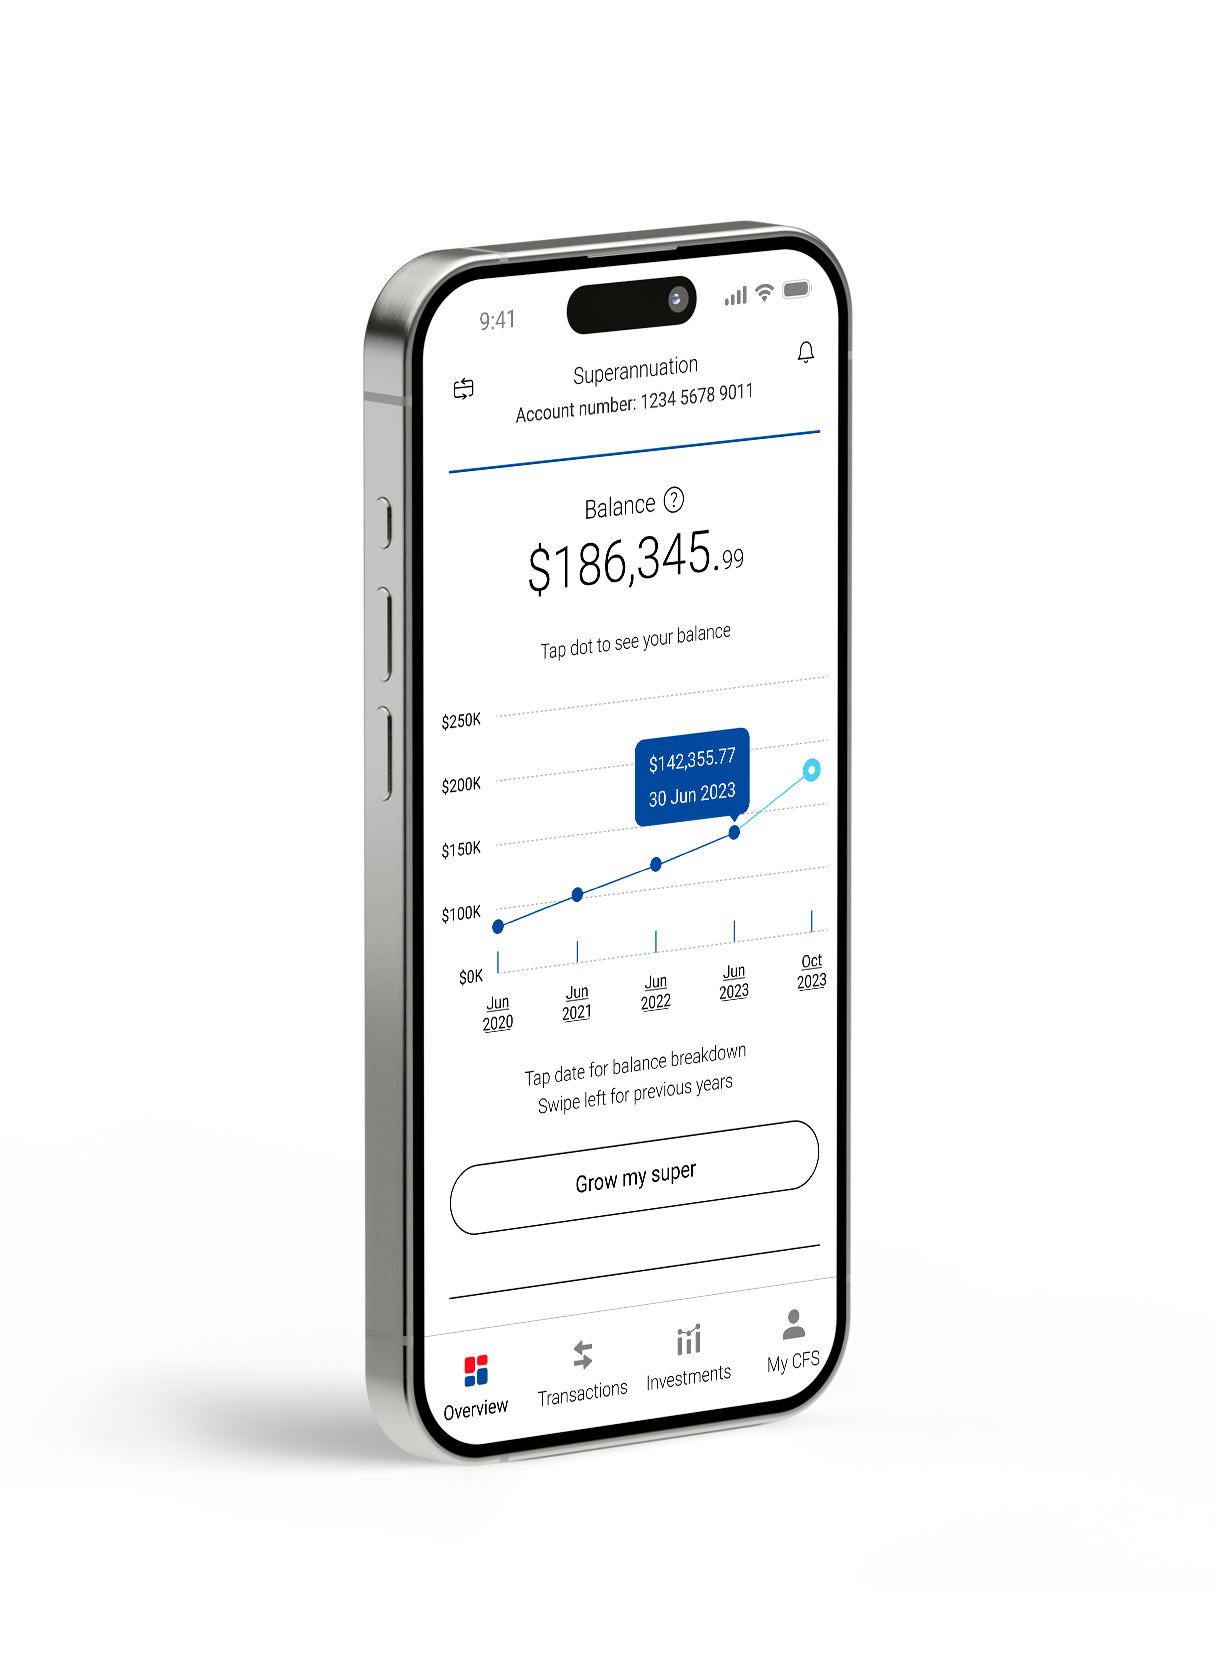
Download our improved app
Discover the confidence that comes with greater knowledge.
With the CFS app, you can easily see how your CFS account is performing thanks to improved charts, graphs and insights.
All of these features paired with faster access to all your information, such as statements, balances, and where your money’s invested - all at your finger tips.


What’s next?
Investing for beginners
Learn everything you need to know to plan and start your investment journey.
Investment Options
Learn about the different types of investments you can make, and which might be right for you.
Investment Glossary
Get your head around common financial and investment terms with our A-Z jargon buster.
We're here to help
Get in touch
Get in touch with us online or call us 8:30am to 6pm (Sydney time) Monday to Friday.
Find the right advice option
Our dedicated team can help you choose from a range of different financial advice options.
Download mobile app
Track your balance and see your transaction history from anywhere.
Avanteos Investments Limited ABN 20 096 259 979, AFSL 245531 (AIL) is the trustee of the Colonial First State FirstChoice Superannuation Trust ABN 26 458 298 557 and issuer of FirstChoice range of super and pension products. Colonial First State Investments Limited ABN 98 002 348 352, AFSL 232468 (CFSIL) is the responsible entity and issuer of products made available under FirstChoice Investments and FirstChoice Wholesale Investments.Information on this webpage is provided by AIL and CFSIL. It may include general advice but does not consider your individual objectives, financial situation, needs or tax circumstances. You can find the target market determinations (TMD) for our financial products at www.cfs.com.au/tmd, which include a description of who a financial product might suit. You should read the relevant Product Disclosure Statement (PDS) and Financial Services Guide (FSG) carefully, assess whether the information is appropriate for you, and consider talking to a financial adviser before making an investment decision. You can get the PDS and FSG at www.cfs.com.au or by calling us on 13 13 36.